1,000+ Quantitative Aptitude Questions for Bank exams - 1
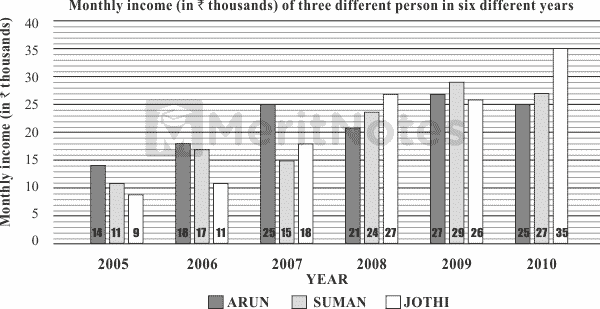
Study the following graph carefully to answer the questions that follow
Question: 1
What was the difference between the total monthly salary of Arun in all the years together and Suman’s monthly income in the year 2007?
(A) Rs. 1.13 lakhs
(B) Rs. 1.24 lakhs
(C) Rs. 11.4 lakhs
(D) Rs. 12.4 lakhs
Ans: A
Total monthly salary of Arun in all the years
= 14000 + 18000 + 23000 + 21000 + 27000 + 25000 = Rs. 1,28,000
Monthly salary of Suman in the year 2007 = Rs. 15000
Difference between their Salary = 128000 - 15000 = Rs. 1.13 Lakh.
Question: 2
Monthly income of Suman in the year 2009 was approximately what percentage of the monthly income of Jyoti in the year 2010?
(A) 72
(B) 83
(C) 89
(D) 91
Ans: B
Monthly income of Suman in year 2009 = Rs. 29000
Monthly income of June in year 2010 = Rs. 35000
= $${29000} / {3500}$$ × 100 = 82.85 = 83%.
Question: 3
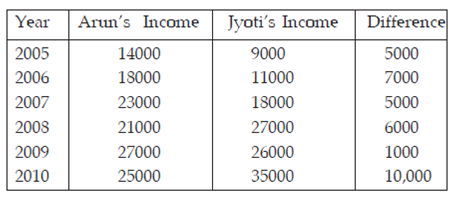
In which year was the difference between Jyoti’s monthly income and Arun’s monthly income second highest?
(A) 2005
(B) 2006
(C) 2007
(D) 2008
Ans: B
In 2006 difference between jyoti's monthly income and Arun's monthly income second highest.
Question: 4
What was the percentage increase in the monthly income of Jyoti in the year 2008 as compared to previous year?
(A) 50
(B) 70
(C) 100
(D) 150
Ans: A
Joyti’s income in 2008 = Rs. 27000
Joyti’s income in 2007 = Rs. 18000
Increase percentage = $${2700 - 1800} / {18000}$$ × 100
= $${9000} / {18000}$$ × 100 = 50%.
Question: 5
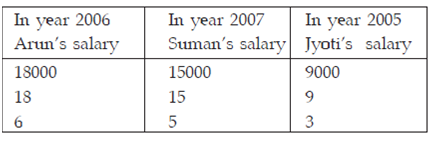
What is the respective ratio between Arun's monthly income in the year 2006, Suman's monthly income in the year 2007 and Jyoti's monthly income in the year 2005?
(A) 5 : 4 : 7
(B) 5 : 6 : 4
(C) 6 : 3 : 5
(D) None of these
Ans: D
- 100+ Data Interpretation Bar Graph Questions and Answers
- 100+ Data Interpretation Bar Charts Questions and Answers
- 1000+ Bar Graph Questions for Bank Exams
- 100+ Bar Graph Questions and Answers Pdf
- 1,000+ Mathematical Aptitude Questions and Answers Pdf
- 1,000+ Quantitative Aptitude Questions for Bank exams
- 100+ Bar Graph Questions for IBPS PO, SO, Clerk Bank Exams Pdf
- 100+ DI Bar Graph Questions for Competitive Exams
- 100+ Bar Charts Questions and Answers for SSC Exams
Wireless Communication MCQ Questions with Answers More
Digital Communication Quiz Questions and Answers Pdf More
Advanced Communication Quiz Questions and Answers Pdf More
Synchronous Machines Quiz Questions and Answers Pdf More
DC Generators Quiz Questions and Answers Pdf More
1000+ UPSC English Question Paper with Answer Pdf More
Advent of Europeans General Knowledge Questions & Answers More
TNPSC Previous Year Question Papers with Answer Keys Pdf More
Cloze Test Questions with Answers Pdf for Competitive Exams More
7000+ Maybank Exam Interview Questions and Answers More