100+ Bar Graph Questions and Answers Pdf - 1
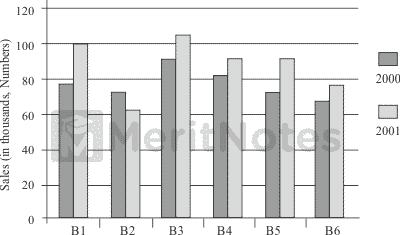
The bar graph given below shows the sales of books (in thousand number from six branches of a publishing company during two consecutive years 2000 and 2001.
Question: 1
Sales of books (in thousands numbers) from six branches B1, B2, B3, B4, B5 and B6 of a publishing company in 2000 and 2001.What is the ratio of the total sales of branch B2 for both years to the total sales of branch B4 for both years?
(A) 4 : 5
(B) 7 : 9
(C) 8 : 5
(D) 10 : 1
Ans: B
Required ratio = $${Total Sales of branch B2 for both years}/{Total Sales of branch B4 for both years}$$
= $${75 + 65} / {85 + 95}$$ = $${140}/{180}$$ = $${7}/{9}$$.
Question: 2
Total sales of branch B6 for both the years is what percent of the total sales of branch B3 for both the years?
(A) 73 : 17
(B) 75.3
(C) 80. 23
(D) 85.7
Ans: A
Total sales of branch B6 for both years = 70 + 80 = 150
Total sales of branch B3 for both years = 95 + 110 = 205
Required percentage $${150}/{205} × 100$$ = 73.7%.
Question: 3
What is the average sales of all the branches (in thousands numbers) for the years 2000?
(A) 73
(B) 77
(C) 80
(D) 87
Ans: C
Total sales of all the six branches (in thousand numbers) for the year 2000 = 80 + 75 + 95 + 85 + 75 + 70) = 480
Average sales of all the six branches (in thousand numbers for the year 2000 = $${480} / {8}$$ = 80.
Question: 4
Total sales branches B1, B3 and B5 together for both the years (in thousands numbers) is?
(A) 250
(B) 315
(C) 435
(D) 560
Ans: D
Total safes of branches B1, B3 and B5 for both the years (in thousands numbers)
= (80 + 105) + (95 + 110) + (75 + 95) = 560.- 100+ Data Interpretation Bar Graph Questions and Answers
- 100+ Data Interpretation Bar Charts Questions and Answers
- 1000+ Bar Graph Questions for Bank Exams
- 100+ Bar Graph Questions and Answers Pdf
- 1,000+ Mathematical Aptitude Questions and Answers Pdf
- 1,000+ Quantitative Aptitude Questions for Bank exams
- 100+ Bar Graph Questions for IBPS PO, SO, Clerk Bank Exams Pdf
- 100+ DI Bar Graph Questions for Competitive Exams
- 100+ Bar Charts Questions and Answers for SSC Exams
Signals and Systems MCQ Questions and Answers Pdf More
Electrical Power Sources Quiz Questions & Answers Pdf More
Electromagnetic Field Theory Question Bank 2024-2025 More
Power Semiconductor Device and Integrated Circuits Questions More
Strength of Materials Questions and Answers Pdf More
Top 100+ Logical Reasoning Test Word Utilization Problems More
Top 1000+ Computer Science Engineering MCQ Online Test More
Manufacturing Industries MCQs Questions for Class 10 Pdf More
1000+ Materials Science MCQ Questions and Answers Pdf More
Zoology Objective Type Questions and Answers More