100+ DI Bar Graph Questions for Competitive Exams - 1
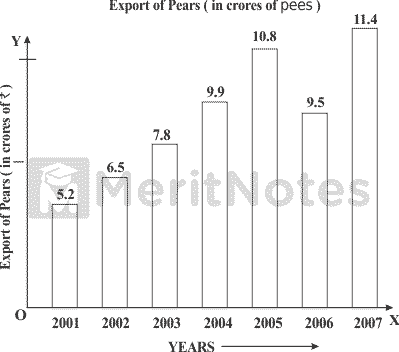
Study the following bar graph carefully and answer the questions given below.
Question: 1
The average export of pearls for the given period (in crores of Rs.) was
(A) 8.7
(B) 8.73
(C) 9.73
(D) 9.93
Ans: B
Average export of pearls over the period
= Rs. {$${1}/{7}(5.2 + 6.5 + 7.8 + 9.9 + 10.8 + 9.5 + 11.4)$$} crores
= Rs. $$({61.1} / {7})$$ crores = Rs. (8.728) crores = Rs. 8.73 crores.
Question: 2
What was the percentage increase in export from 2006 to 2007?
(A) 17%
(B) 18%
(C) 20%
(D) 21%
Ans: C
Percentage increase in export from 2006 to 2007
= $$[{(11.4 – 9.5)}/{9.5} × 100]$$%
= $$({1.9}/{9.5} × 100)$$%
= $$({19} / {95} × 100)$$% = 20%.
Question: 3
In which of the following pairs of years was the average export of pearls around Rs. 9 crores?
(A) 2002 and 2003
(B) 2003 and 2004
(C) 2004 and 2005
(D) 2005 and 2006
Ans: B
Average export in 2003 and 2004 = Rs. $$({7.8 + 9.9} / {2} )$$ crores
= Rs. $$({17.7} / {2})$$crores = Rs. 8.85 crores = Rs. 9 crores (nearly)
Question: 4
In how many years was the export above average for the given period?
(A) 1
(B) 2
(C) 3
(D) 4
Ans: D
Average export during the given period = Rs. 8.73 crores.
It was above average in 2004, 2005, 2006 and 2007, i.e. in 4 years.
Question: 5
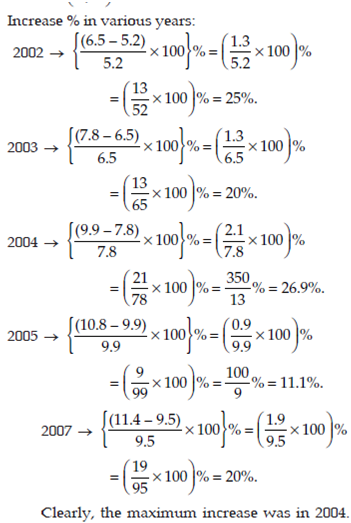
In which year was there maximum percentage increase in export of pearls to that in the previous year?
(A) 2002
(B) 2004
(C) 2007
(D) 2008
Ans: B
- 100+ Data Interpretation Bar Graph Questions and Answers
- 100+ Data Interpretation Bar Charts Questions and Answers
- 1000+ Bar Graph Questions for Bank Exams
- 100+ Bar Graph Questions and Answers Pdf
- 1,000+ Mathematical Aptitude Questions and Answers Pdf
- 1,000+ Quantitative Aptitude Questions for Bank exams
- 100+ Bar Graph Questions for IBPS PO, SO, Clerk Bank Exams Pdf
- 100+ DI Bar Graph Questions for Competitive Exams
- 100+ Bar Charts Questions and Answers for SSC Exams
DC Generator Questions and Answers Pdf More
Electromagnetic Induction Quiz Questions and Answers More
Basic Electronics Quiz Questions with Answers Pdf More
Wireless Communication MCQ Questions with Answers More
Digital Communication Quiz Questions and Answers Pdf More
1000+ Percentage Aptitude Questions for SBI PO More
Metallurgical Kinetics Objective Questions and Answers Pdf More
GATE Computer Science Engineering Questions & Answers 2024 - 2025 Pdf More
Professional Ethics Multiple Choice Questions and Answers More
1000+ General English Questions & Answers | Word Correction More