1000+ Data Interpretation (DI) Line Graph Questions with Answers - 1
Study the following line graph carefully and answer the questions given below.
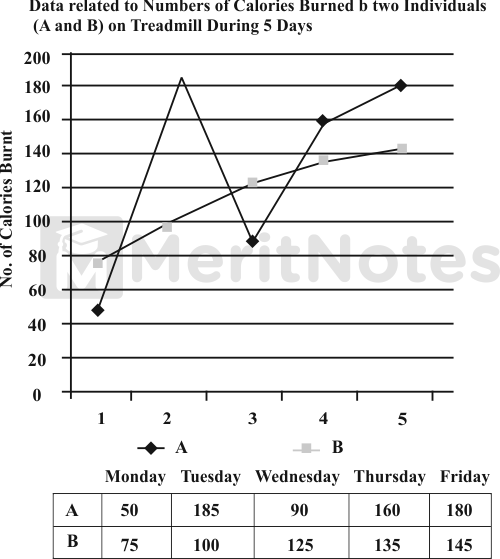
Question: 1
What is the respective ratio of total number of total number of calories burned by A and B together on Wednesday and by the same individuals together on Tuesday?
(A) 41 : 57
(B) 43 : 57
(C) 43 : 61
(D) 45 : 59
Ans: B
Total number of calories burnt by A and B together
on Wednesday = 90 + 125 = 215.
Total number of calories burnt by A and B together
on Tuesday = 185 + 100 = 285.
Required ratio = 215 : 285 = 43 : 57.
Question: 2
If the number of calories burned by A and B increased by 10% and 20% respectively from Friday to Saturday, what was the total number of calories burned by them together on Saturday?
(A) 368
(B) 370
(C) 372
(D) 378
Ans: C
Total number of calories burnt on Saturday
= $$180 × {110} / {100} + 145 × {120} / {100}$$ = 198 + 174 = 372.
Question: 3
What is the total number of calories burned by A on Tuesday, Wednesday and Thursday together?
(A) 425
(B) 435
(C) 445
(D) 455
Ans: B
Total number of calories burnt by A = 185 + 90 + 160 = 435.
Question: 4
If the average number of calories burned by B on Thursday, Friday and Saturday together is 125, what was the number of calories burned by B on Saturday?
(A) 90
(B) 92
(C) 95
(D) 115
Ans: C
Average calories = 125
Total calories = 3 × 125 = 375
Number of calories burnt on Saturday = 375 - 280 = 95.
Question: 5
Number of calories burned by B increased by what percent from Monday to Thursday?
(A) 60%
(B) 70%
(C) 80%
(D) 90%
Ans: C
Required percentage = $${60} / {75} × 100$$ = 80%.
- 100+ Line Graph Data interpretation Questions and Answers
- 100+ Line Charts Data Interpretation Questions and Answers
- Top 100+ Line Graph Questions for Competitive Exams
- Line Graph, Charts Questions for Bank Exam
- Line Chart Data Interpretation Questions for IBPS PO, SO, Clerk Exams
- 1000+ Line Graph Questions for Bank PO
- 1000+ Data Interpretation Aptitude Questions and Answers Pdf
- 1000+ Data Interpretation (DI) Line Graph Questions with Answers
Power Semiconductor Device and Integrated Circuits Questions More
Strength of Materials Questions and Answers Pdf More
Steam and Power Generation Quiz Questions & Answers Pdf More
Dc generator questions and answers pdf More
DC Generator Questions and Answers Pdf More
1000+ Last 15 Years GATE Papers with Solutions Pdf More
Non Verbal Reasoning Grouping of Identical Figures Questions More
General Awareness Quiz, Gk Questions and Answers, Online Test More
1000+ Fana Aptitude Test and Interview Pdf More
1000+ Problems on Numbers Questions and Answers Pdf More