100+ Line Charts Data Interpretation Questions and Answers - 1
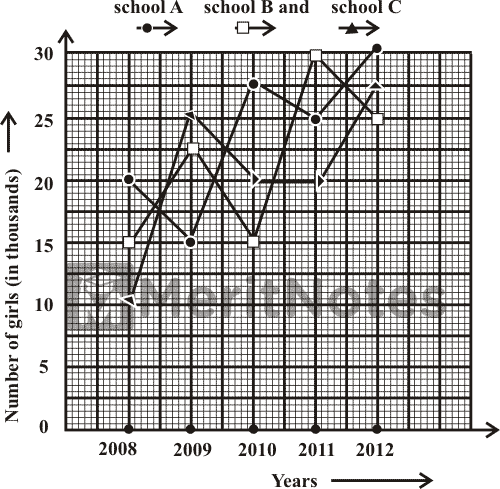
Study the following graph carefully and answer the questions that follow.
Question: 1
What was the ratio between the number of girls enrolled in School C in the year 2011 and the total number of girls enrolled in School A and School B together in the same year?
(A) 3 : 11
(B) 4 : 7
(C) 4 : 11
(D) 11 : 3
Ans: C
Required ratio = 20000 : (25000 + 30000)
= 20000 : 55000 = 20 : 55 = 4 : 11.
Question: 2
In which year was the total number of girls enrolled in all the three schools together second highest?
(A) 2008
(B) 2010
(C) 2011
(D) 2012
Ans: C
Total number of girls enrolled in all the three schools in various years (in thousands)
2008 → (20 + 15 + 10) = 45
2009 → (15 + 22.5 + 25) = 62.5
2010 → (27.5 + 15 + 20) = 62.5
2011 → (25 + 30 + 20) = 75
2012 → (30 + 25 + 27.5) = 82.5.
Clearly, it was second highest in 2011.
Question: 3
In which school was the difference between the number of girls enrolled in the year 2012 and 2008 minimum?
(A) Only School A
(B) Only School B
(C) Only School C
(D) Both School A and School B
Ans: D
Difference between the number of girls enrolled in 2012 and 2008 (in thousands) :
A → (30 – 20) = 10;
B → (25 – 15) = 10;
C → (27.5 – 10) = 17.5
So, it was minimum in both A and B.
Question: 4
What was the approximate average number of girls enrolled in the year 2010 in all the three schools together?
(A) 20000
(B) 20800
(C) 21600
(D) 22500
Ans: B
Required average = $${1}/{3}(27.5 + 15 + 20)$$ thousands
= $$({62.5} / {3} × 1000)$$ = $${62500} / {3}$$
= 20833 = 20800(approx.)
Question: 5
Total number of girls enrolled in all the three schools in the year 2008 was what percentage of the number of girls enrolled in School C in the year 2011?
(A) 165%
(B) 225%
(C) 240%
(D) 260%
Ans: B
Required percentage = $$[{(20 + 15 + 10) × 1000} / {20 × 1000} × 100]$$%
= $$[{45}/{20} × 100]$$% = 225%.
- 100+ Line Graph Data interpretation Questions and Answers
- 100+ Line Charts Data Interpretation Questions and Answers
- Top 100+ Line Graph Questions for Competitive Exams
- Line Graph, Charts Questions for Bank Exam
- Line Chart Data Interpretation Questions for IBPS PO, SO, Clerk Exams
- 1000+ Line Graph Questions for Bank PO
- 1000+ Data Interpretation Aptitude Questions and Answers Pdf
- 1000+ Data Interpretation (DI) Line Graph Questions with Answers
DC Generator Questions and Answers Pdf More
Electromagnetic Induction Quiz Questions and Answers More
Basic Electronics Quiz Questions with Answers Pdf More
Wireless Communication MCQ Questions with Answers More
Digital Communication Quiz Questions and Answers Pdf More
1000+ Computer Awareness for IBPS Bank PO, SO, CLERK Exam More
TNPSC Group 4 Physics Study Material in English Tamil More
1000+ Last 15 Years GATE Papers with Solutions Pdf More
Comparison of Ranks Verbal Reasoning Questions and Answers More
Gk Questions on Branches of Science and their Definitions More