100+ Line Graph Data interpretation Questions and Answers - 1
Refer to the graph and answer the given questions.
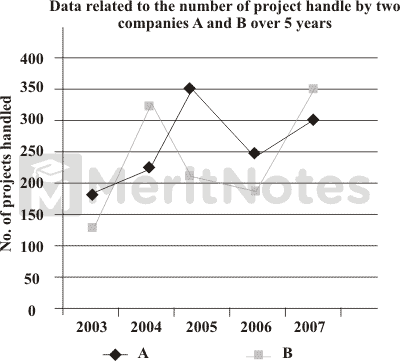
Question: 1
Out of the total number of projects handled by Company A in 2005 and 2006 together, 20% were government projects. What was the total number of governmental projects handled by Company A in 2005 and 2006 together?
(A) 116
(B) 122
(C) 128
(D) 132
Ans: B
Number of governmental projects handled by company A in 2005 and 2006 together = 360 + 250 = 610.
Number of Governmental projects handled by company A in 2005 and 2006 together = 20% of 610 = $${20 × 610} / {100}$$ = 122.
Question: 2
The projects handled by a company can be broadly classified into two types: government projects and non-governmental projects. If the average number of non-governmental projects handled by the same company B in 2003 and 2004 is 127. What is the total number of governmental projects handled by the same company in 2003 and 2004 together?
(A) 188
(B) 192
(C) 196
(D) 212
Ans: C
Average number of non-governmental projects handled by company B = 127.
Average number of non-governmental projects handled by company B in 2003 and 2004 is = 127 × 2 = 254.
Average number of non-governmental projects handled by company B in 2003 and 2004 together = 130 + 320 - 254 = 40 – 254 = 196.
Question: 3
The number of projects handled by Company B decreased by what percent from 2004 to 2006?
(A) $$35{5}/{8}$$
(B) $$40{5}/{8}$$
(C) $$45{5}/{8}$$
(D) $$55{5}/{8}$$
Ans: B
Number of projects handled by Company B in 2004 = 320.
Number of projects handled by Company B in 2006 = 190.
Required decrease percentage = $${320 – 190} / {320} × 100$$
= $${130} / {320} × 100$$ = $${1300} / {32}$$% = $${325} / {8}$$ = $$40{5}/{8}$$% decrease.
Question: 4
If the number of projects handled by company A increased by 20% from 2007 to 2008 and by 5% from 2008 to 2009 what was the number of projects handled by Company A in 2009?
(A) 372
(B) 374
(C) 378
(D) 384
Ans: C
Number of projects handled by company A in 2008
= 120% of 300 = $${120 × 300} / {100}$$ = 360
Number of projects handled by company A in 2009
= 105% of 360 = $${105 × 360} / {100}$$ = 378.
Question: 5
What is the difference between the total number of projects handled by company A in 2003 and 2004 together and the total number of projects handled by company B in 2005 and 2007 together?
(A) 130
(B) 140
(C) 150
(D) 180
Ans: C
The number of projects handled by company A in 2003 and 2004 together = 180 + 230 = 410.
The number of projects handled by company B in 2005 and 2007 together = 210 + 350 = 560.
Required difference = 560 – 410 = 150.
- 100+ Line Graph Data interpretation Questions and Answers
- 100+ Line Charts Data Interpretation Questions and Answers
- Top 100+ Line Graph Questions for Competitive Exams
- Line Graph, Charts Questions for Bank Exam
- Line Chart Data Interpretation Questions for IBPS PO, SO, Clerk Exams
- 1000+ Line Graph Questions for Bank PO
- 1000+ Data Interpretation Aptitude Questions and Answers Pdf
- 1000+ Data Interpretation (DI) Line Graph Questions with Answers
Basic Electronics Quiz Questions with Answers Pdf More
Wireless Communication MCQ Questions with Answers More
Digital Communication Quiz Questions and Answers Pdf More
Advanced Communication Quiz Questions and Answers Pdf More
Synchronous Machines Quiz Questions and Answers Pdf More
7000+ TNMAWS Questions and Answers Pdf More
1000+ Computer Awareness MCQ with Answers Pdf More
1000+ Gate 2023 - 2024 Syllabus Mechanical Engineering Pdf More
Computer Science Quiz Questions with Answers Multiple Choice 2019-2020 More
1000+ Electrostatics Questions and Answers Pdf More