1000+ Bar Graph Questions for Bank Exams - 1
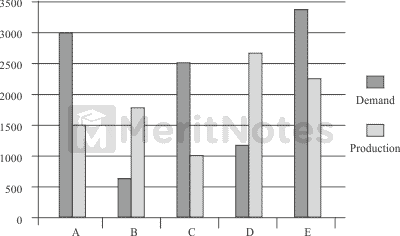
The following chart represents Demand and Production for 5 companies ABCDE. On the basis of the given answer the questions.

Question: 1
If company A desires to meet the demand by purchasing surplus production of company, then the most suitable company is
(A) A
(B) B
(C) C
(D) D
(E) E
Ans: B
Difference between demand and production of company A
= 3000 - 1500 = 1500
Difference between production and demand of company D
= 2700 - 1200 = 1500.
Question: 2
The difference between average demand and average production of the five companies taken together is
(A) 130
(B) 280
(C) 480
(D) 620
Ans: B
Total production of the five companies
= 1500 + 1800 + 1000 + 2700 + 2200 = 9200.
Total demand of the five companies
= 3000 + 600 + 2500 + 1200 + 3300 = 10600.
Required difference = $${1}/{5}$$(10600 - 9200) = $${1}/{5} × 1400$$ = 280.
Question: 3
The ratio of the number of companies having more demand to those having more production than production than demand is
(A) 1 : 2
(B) 2 : 2
(C) 3 : 2
(D) 4 : 1
Ans: C
Number of companies having more demand than production = 3.
Number of companies having more production than demand = 2.
Required ratio = 3 : 2.
Question: 4
If the production of company D is h times of the production of company A. Then h equals
(A) 1.2
(B) 1.5
(C) 1.8
(D) 2.5
Ans: C
Production of company D = 2700
Production of company A = 1500
h = $${Production of company D} / {Production of company A}$$
= $${2700} / {1500}$$ = $${9} /{5}$$ = 1.8.
Question: 5
If x% of demand for company C equals demand for company B, then x equals.
(A) 4
(B) 20
(C) 24
(D) 60
Ans: C
Given x% of demand for company C = Demand for company B.
⇒ $${2500 × x} / {100}$$ = 600
⇒ 25x = 600
⇒ x = $${600} / {25}$$ = 24.
- 100+ Data Interpretation Bar Graph Questions and Answers
- 100+ Data Interpretation Bar Charts Questions and Answers
- 1000+ Bar Graph Questions for Bank Exams
- 100+ Bar Graph Questions and Answers Pdf
- 1,000+ Mathematical Aptitude Questions and Answers Pdf
- 1,000+ Quantitative Aptitude Questions for Bank exams
- 100+ Bar Graph Questions for IBPS PO, SO, Clerk Bank Exams Pdf
- 100+ DI Bar Graph Questions for Competitive Exams
- 100+ Bar Charts Questions and Answers for SSC Exams
Dc generator questions and answers pdf More
DC Generator Questions and Answers Pdf More
Electromagnetic Induction Quiz Questions and Answers More
Basic Electronics Quiz Questions with Answers Pdf More
Wireless Communication MCQ Questions with Answers More
Synonyms Questions for Bank Exam 2024-2025 More
Logical Reasoning Deriving Conclusions Quetsions and Answers More
1000+ Suncorp Bank Aptitude Test Questions and Answers Pdf More
1000+ General English Questions & Answers for SBI Clerk Exam More
Top 100+ Sentence Improvement Questions for SSC Exams More