Tabulation DI (Data Interpretation) Online Test - 1
Question: 1
What is the approximate percentage decrease in the number of boys in School D in the year 2008 as compared to that in the previous year?
(A) 5%
(B) 9%
(C) 12%
(D) 17%
Ans: D
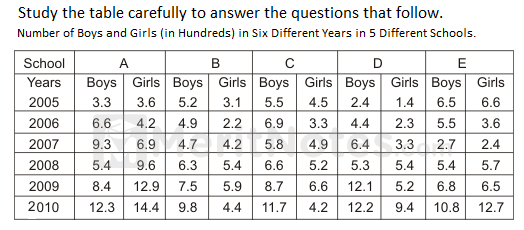
Number of boys in School D in 2007 = (6.4 x 100) = 640.
Number of boys in School D in 2008 = (5.3 x 100) = 530.
Decrease % = $$({110} / {640} x 100)$$% = $${275} / {16}$$% = 17.1% = 17%.
Question: 2
The number of girls in School B in the year 2009 is approximately what percent of the total number of students in School E in the year 2006?
(A) 52%
(B) 58%
(C) 60%
(D) 65%
Ans: D
Number of girls in School B in 2009 = (5.9 x 100) = 590.
Total number of students in School E in 2006 = (5.5 + 3.6) × 100 = (9.1 × 100) = 910.
Required % = $$({590} / {910} × 100)$$% = $${5900} / {91}$$%. = 64.8% = 65%(nearly).
Question: 3
What is the average number of girls in School A in all the years taken together?
(A) 600
(B) 760
(C) 800
(D) 860
Ans: D
Average number of girls in School A over the years
=$${(3.6 + 4.2 + 6.9 + 9.6 + 12.9 + 14.4) × 100} /{6}$$
= $$({51.6 × 100} / {6})$$ = $${5160} / {6}$$ = 860.
Question: 4
What is the ratio of the number of boys in School C in the year 2009 to the number of girls in School A in the year 2009?
(A) 29: 41
(B) 29 : 43
(C) 36 : 11
(D) 36 : 13
Ans: B
(Number of boys in C in 2009) : (Number of girls in A in 2009)
= (8.7 x 100) : (12.9 x 100)
= $${870} / {1290}$$ = $${29} / {43}$$ = 29 : 43.
Question: 5
In which year is the total number of students the third highest in School E?
(A) 2005
(B) 2006
(C) 2007
(D) 2008
Ans: B
Total number of students in School E in various years:
2005 ⇒ (6.5 + 6.6) × 100 = 1310,
2006 ⇒ (5.5 + 3.6) × 100 = 910,
2007 ⇒ (2.7 + 2.4) × 100 = 510,
2008 ⇒ (5.4 + 5.7) × 100 = 1110,
2009 ⇒ (6.8 + 6.5) × 100 = 1330,
2010 ⇒ (10.8 + 12.7) × 100 = 2350.
It is highest in 2010, 2nd highest in 2009 and third highest in 2005.
- 100+ Tabulation Data Interpretation Questions and Answers
- 100+ Data Interpretation Questions and Answers for Bank Exams
- 100+ Tabulation Questions for Bank Exams
- 100+ Data Interpretation Questions with Solutions for Bank PO Pdf
- 100+ Tabulation Questions and Answers for SSC Exam
- 1,000+ Data Interpretation Questions for Competitive Exams
- 100+ Tabulation DI Questions for SBI, IBPS PO, SO, Clerk Pdf
- Tabulation DI (Data Interpretation) Online Test
Signals and Systems Quiz Questions and Answers Pdf More
Signals and Systems MCQ Questions and Answers Pdf More
Electrical Power Sources Quiz Questions & Answers Pdf More
Electromagnetic Field Theory Question Bank 2024-2025 More
Power Semiconductor Device and Integrated Circuits Questions More
Computer Knowledge MCQ for IBPS, SBI, RBI Bank Exams 2020-2021 More
History Online Test 2020-2021 More
Top 10,000+ World GK Quiz Questions and Answers 2020-2021 More
List of Chief Justices Of India from 1950-2019 Pdf Download More
100+ Inorganic Chemistry MCQ Questions and Answers pdf More