100+ Bar Charts Questions and Answers for SSC Exams - 1
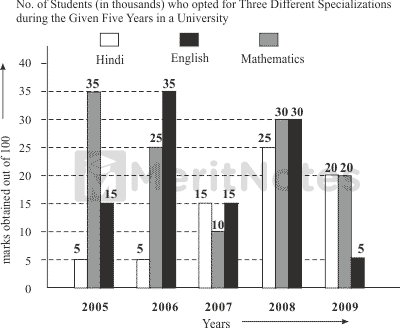
Study the following graph carefully and answer the questions that follow.
Question: 1
Out of the total number of students who opted for the given three subjects in the year 2009, 38% were girls. How many boys opted for Mathematics in the same year?
(A) 1312
(B) 1322
(C) 1332
(D) Cannot be determined
Ans: D
Number of students who opted for the given three subjects in the year 2009 is (20000 + 20000 + 5000) = 45000.
Number of girls = 38% of 45000
= $$(45000 × {38}/{100})$$ = 17100.
Out of these, the number of boys who opt for Mathematics cannot be found.
Question: 2
If the total number of students in the university in the year 2007 was 455030, the total number of students who opted for the given three subjects was approximately what percent of the total students?
(A) 5
(B) 9
(C) 12
(D) 19
Ans: B
In 2007, we have
Total number of students = 455030
Number of those choosing the given three subjects = (15000 + 10000 + 15000) = 40000
Required percentage = $$({40000}/{455030}$$ × 100)%
= 8.79% = 9%.
Question: 3
What is the ratio of the number of students who opted for English in the year 2006 and 2008 together to the number of students who opted for Hindi in the year 2005 and 2009 together?
(A) 11 : 2
(B) 11 : 5
(C) 11 : 7
(D) 11 : 9
Ans: B
Ratio of the number who opted for English in 2006 and 2008 to the number who opted for Hindi in 2005 and 2009
= (25 + 30) : ( 5 + 20) = 55 : 25 = 11 : 5.
Question: 4
What is the total number of students who opted for Hindi and Mathematics in the year 2006, 2007 and 2009 together?
(A) 97000
(B) 96000
(C) 85000
(D) 95000
Ans: D
Number of students who opt Hindi and Mathematics in 2006, 2007 and 2009
= [(5 + 35) + (15 + 15] + (20 + 5)] thousands = 95000.
Question: 5
The total number of students who opted for Mathematics in the year 2005 and 2008 together is approximately what percent of the total number of students who opted for all three subjects in the same year?
(A) 28
(B) 32
(C) 42
(D) 52
Ans: B
Number of students opting Mathematics in 2005 and 2008 = (15000 + 30000) = 45000.
Number of students opting for the these three subjects in 2005 and 2008
= [(5 + 35 + 15) + (25 + 30 + 30) thousands]
= (55000 + 85000) = 140000.
Required% = $$({45000} / {140000} × 100)$$% = $${225}/{7}$$% = 32%(nearly).
- 100+ Data Interpretation Bar Graph Questions and Answers
- 100+ Data Interpretation Bar Charts Questions and Answers
- 1000+ Bar Graph Questions for Bank Exams
- 100+ Bar Graph Questions and Answers Pdf
- 1,000+ Mathematical Aptitude Questions and Answers Pdf
- 1,000+ Quantitative Aptitude Questions for Bank exams
- 100+ Bar Graph Questions for IBPS PO, SO, Clerk Bank Exams Pdf
- 100+ DI Bar Graph Questions for Competitive Exams
- 100+ Bar Charts Questions and Answers for SSC Exams
Signals and Systems Quiz Questions and Answers Pdf More
Signals and Systems MCQ Questions and Answers Pdf More
Electrical Power Sources Quiz Questions & Answers Pdf More
Electromagnetic Field Theory Question Bank 2024-2025 More
Power Semiconductor Device and Integrated Circuits Questions More
1000+ Nigerian Banks Aptitude Test Questions and Answers More
Biology Objective Type Questions and Answers More
100+ Error Spotting Questions and Answers for Bank Exams More
1000+ Civil Engineering Quiz Questions and Answers Pdf More
Top 100+ Decimal Fraction Questions and Answers Pdf More