Line Graph, Charts Questions for Bank Exam - 1
Question: 1
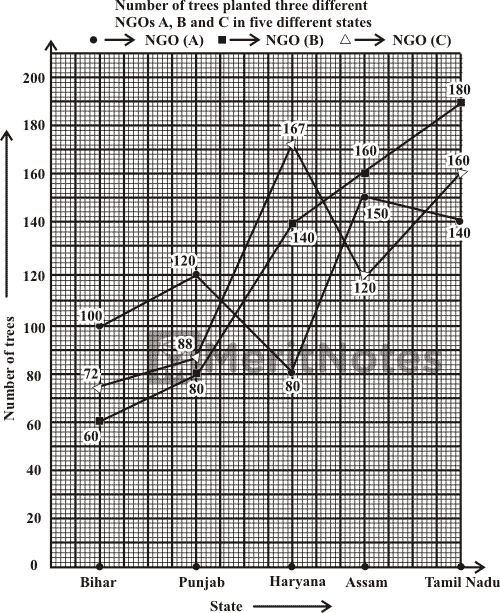
In which of the following states was the total number of trees planted by NGOs A and B together second lowest?
(A) Assam
(B) Haryana
(C) Punjab
(D) Bihar
Ans: C
Total number of trees planted by A and B in :
Bihar → (100 + 60) = 160
Punjab → (120 + 80) = 200
Haryana → (140 + 80) = 220
Assam → (150 + 160) = 310
Tamil Nadu → (140 + 180) = 320
It is second lowest in Punjab.
Question: 2
What was the ratio of the number of trees planted by NGO – B in Tamil Nadu, the number of trees planted by NGO – C in Assam and the number of trees planted by NGO – A in Assam?
(A) 5 : 3 : 6
(B) 5 : 6 : 3
(C) 6 : 4 : 5
(D) 6 : 5 : 3
Ans: C
Required ratio = 180 : 120 : 150 = 6 : 4 : 5.
Question: 3
The total number of trees planted by NGOs A and B together in Bihar was approximately what percentage of the total number of trees planted by NGOs B and C together in Punjab?
(A) 83
(B) 95
(C) 110
(D) 125
Ans: B
Required = $$[{(100 + 60)} / {(80 + 88)} × 100]$$%
= $$({160} / {168} × 100)$$%
= $${2000} / {21}$$ = 95% (approx.)
Question: 4
What was the average number of trees planted in Haryana by all the NGOs together?
(A) 129
(B) 140
(C) 390
(D) 420
Ans: A
Average number of trees planted in Haryana by 3 NGOs
= $${1}/{3}(80 + 140 + 167)$$ = $${387} / {3}$$ = 129.
Question: 5
What was the difference between the trees planted by NGO – A in Haryana and those planted by NGO – C in Tamil Nadu?
(A) 60
(B) 70
(C) 80
(D) 90
Ans: C
Trees planted by C in Tamil Nadu) - (Trees planted by A in Haryana)= (160 - 80) = 80.
- 100+ Line Graph Data interpretation Questions and Answers
- 100+ Line Charts Data Interpretation Questions and Answers
- Top 100+ Line Graph Questions for Competitive Exams
- Line Graph, Charts Questions for Bank Exam
- Line Chart Data Interpretation Questions for IBPS PO, SO, Clerk Exams
- 1000+ Line Graph Questions for Bank PO
- 1000+ Data Interpretation Aptitude Questions and Answers Pdf
- 1000+ Data Interpretation (DI) Line Graph Questions with Answers
Signals and Systems Quiz Questions and Answers Pdf More
Signals and Systems MCQ Questions and Answers Pdf More
Electrical Power Sources Quiz Questions & Answers Pdf More
Electromagnetic Field Theory Question Bank 2024-2025 More
Power Semiconductor Device and Integrated Circuits Questions More
7000+ Odd One Out Puzzles with Answers More
1000+ Computer Graphics MCQ Questions and Answers Pdf More
Civil Engineering RCC Structures Design Interview Questions & Answers More
Units and Measurement GK Objective Questions and Answers More
DBMS Practical Viva Questions and Answers More