Top 100+ Line Graph Questions for Competitive Exams - 1
Question: 1
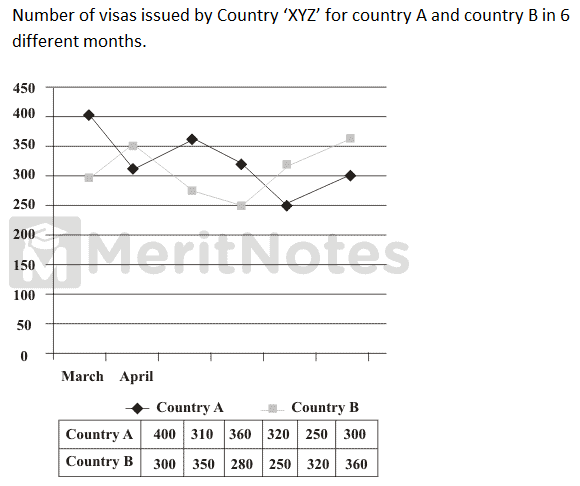
What is the difference between the total number of visas issued for Country A and Country B together in April and the total number of visas issued for both the countries together in June?
(A) 70
(B) 78
(C) 90
(D) 94
Ans: C
Visas issued for country A and country B in April = 310 + 350 = 660
Visas issued for country A and countr B in June = 320 + 250 = 570
Required difference = 660 – 570 = 90.
Question: 2
What is the average number of visas issued for Country B in March, May, July and August?
(A) 310
(B) 315
(C) 320
(D) 325
Ans: B
Total number of visas issued for country B in March, May, July and August = 300 + 280 + 320 + 360 = 1260
Required average = $${300 + 280 + 320 + 360} / {4}$$ = $${1260} / {4}$$ = 315.
Question: 3
The number of visas issued for Country B in March is what percent less than the number of visas issued for country A in June?
(A) 4.25
(B) 6.25
(C) 7.75
(D) 8.5
Ans: B
Number of visas issued for country B in March = 300
Number of visas issued for country A in June = 320
Required percent = $${320 - 300} / {320}$$ × 100 = 6.25.
Question: 4
The number of visas issued for Country A in March decreased by 20% from the previous month. What is the respective ratio between the number of visas issued for Country A in February and the number of visas issued for the same country in May?
(A) 24 : 13
(B) 25 : 13
(C) 25 : 18
(D) 26 : 15
Ans: C
Number of visas for country A in February = $${400 × 100}/{80}$$ = 500
∴ Required ratio = 500 : 360 = 25 : 18.
Question: 5
The number of visas issued for Country A decreased by what percent from May to July?
(A) $$30{5}/{9}$$%
(B) 33
(C) $$33{2}/{3}$$%
(D) $$35{1}/{3}$$%
Ans: A
Number of visas issued for country A in May = 360
Number of visas issued for country A in July = 250
Percentage decreases = $${360 – 250} / {360} × 100$$
= $${1100}/{36}$$ = $${275}/{9}$$ = $$30{5}/{9}$$%
- 100+ Line Graph Data interpretation Questions and Answers
- 100+ Line Charts Data Interpretation Questions and Answers
- Top 100+ Line Graph Questions for Competitive Exams
- Line Graph, Charts Questions for Bank Exam
- Line Chart Data Interpretation Questions for IBPS PO, SO, Clerk Exams
- 1000+ Line Graph Questions for Bank PO
- 1000+ Data Interpretation Aptitude Questions and Answers Pdf
- 1000+ Data Interpretation (DI) Line Graph Questions with Answers
Samacheer Kalvi Class 10 Science Acoustics Questions & Answers More
Agricultural Engineering Multiple Choice Questions and Answers Pdf More
Soil, Water Conservation Engineering, Hydrology, Surveying MCQ Questions More
Irrigation and Drainage Engineering, Wells & Pumps MCQ Questions Pdf More
Agricultural Engineering Farm Power MCQ Questions and Answers More
Climate, Forest, Soil and Natural Vegetation TNPSC MCQ Questions More
1000+ Non Verbal Reasoning Questions for SSC Exams Pdf More
100+ Vocabulary Words with Meaning Synonyms & Antonyms More
Java Servlets and JSP Interview Questions and Answers More
Important Days GK Questions for TNPSC, IBPS, SSC, UPSC, TNEA, NEET, Bank More