1000+ Line Graph Questions for Bank PO - 1
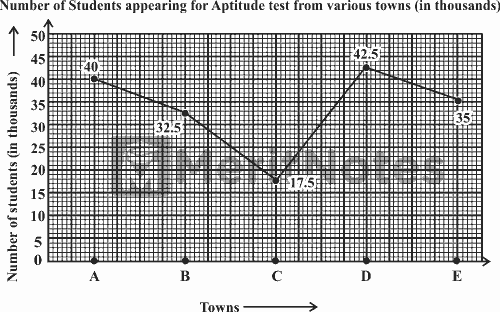
Study the following line graph carefully and answer the questions given below.
Question: 1
What is the ratio of the number of students appearing for the Aptitude Test from Town B to that from Town A?
(A) 2 : 3
(B) 3 : 4
(C) 11 : 16
(D) 13 : 16
Ans: D
Ratio of number of students from Town B to that from Town A
= $${32.5 × 1000} / {40 × 1000}$$ = $${325} / {400}$$ = $${13}/{16}$$ = 13 : 16.
Question: 2
What is the average number of students appearing for the Aptitude Test from all the towns together?
(A) 33.5
(B) 3350
(C) 17500
(D) 33500
Ans: D
Average number of students appearing in Aptitude Test from all towns
= $$({(40 + 32.5 + 17.5 + 42.5 + 35) × 1000}/{5})$$
= $${167.5 × 1000} / {5}$$
= (33.5 × 1000) = 33500.
Question: 3
The number of students appearing for the Aptitude Test from Town E is approximately what percent of the total number of students appearing for the Aptitude Test from all the towns together?
(A) 15
(B) 19
(C) 21
(D) 23
Ans: C
Required % = $$[{35 × 1000} / {167.5 × 1000} × 100]$$%
= $$({350 × 100} / {1675})%$$ = $${1400} / {67}$$%
= 20.89% ≈ 21% (nearly).
Question: 4
What is the ratio of the number of students appearing for the Aptitude Test from Towns C and D together to the number of students appearing for the Arithmetic Test from Towns A, D and E together?
(A) 20 : 47
(B) 24 : 47
(C) 37 : 20
(D) 47 : 20
Ans: B
(Students from Towns C and D) : (Students from Towns A, D and E)
= $${(17.5 + 42.5) × 1000} / {(40 + 42.5 + 35) × 1000}$$
= $${60}/ {117.5}$$ = $${600} / {1175}$$ = $${24}/ {47}$$ = 24 : 47.
Question: 5
The number of students appearing for the Aptitude Test from Town D is approximately what percentage of the number of students appearing for the Aptitude Test from Town C?
(A) 134
(B) 243
(C) 314
(D) 413
Ans: B
Required percentage = $$({42.5 × 1000} / {17.5 × 1000} × 100)$$%
= $$({425} / {175} × 100)$$% = $$({425 × 4} / {7})$$%
= $${1700}/{7}$$% = 242.85% ≈ 243% (nearly).
- 100+ Line Graph Data interpretation Questions and Answers
- 100+ Line Charts Data Interpretation Questions and Answers
- Top 100+ Line Graph Questions for Competitive Exams
- Line Graph, Charts Questions for Bank Exam
- Line Chart Data Interpretation Questions for IBPS PO, SO, Clerk Exams
- 1000+ Line Graph Questions for Bank PO
- 1000+ Data Interpretation Aptitude Questions and Answers Pdf
- 1000+ Data Interpretation (DI) Line Graph Questions with Answers
Signals and Systems Quiz Questions and Answers Pdf More
Signals and Systems MCQ Questions and Answers Pdf More
Electrical Power Sources Quiz Questions & Answers Pdf More
Electromagnetic Field Theory Question Bank 2024-2025 More
Power Semiconductor Device and Integrated Circuits Questions More
100+ Alphabet Puzzles Questions with Answers More
1,000+ Data Interpretation Questions for Competitive Exams More
Analogy Online More
100+ Alphanumeric Series Questions for Bank, SSC Exams Pdf More
7000+ Gk Questions with Answers 2024 - 2025 for SSC, UPSC Exam More